

Firn
Well-known member
- Thread starter
- #1
Following up on my previous post about deconstructing PIDs from Forscan and CarScanner, I’ve been using a long-term monitoring setup to see how my Lightning Pro ER actually behaves under the hood.
The Setup:
1. Performance vs. State of Charge (SOC)
A common question is whether the truck limits current as the SOC drops.
Current: Looking at the data, the answer appears to be no. Maximum current remains remarkably consistent even as SOC decreases.

Power: While current stays steady, total power does drop slightly as SOC falls. This is the expected result of voltage sag as the battery depletes.

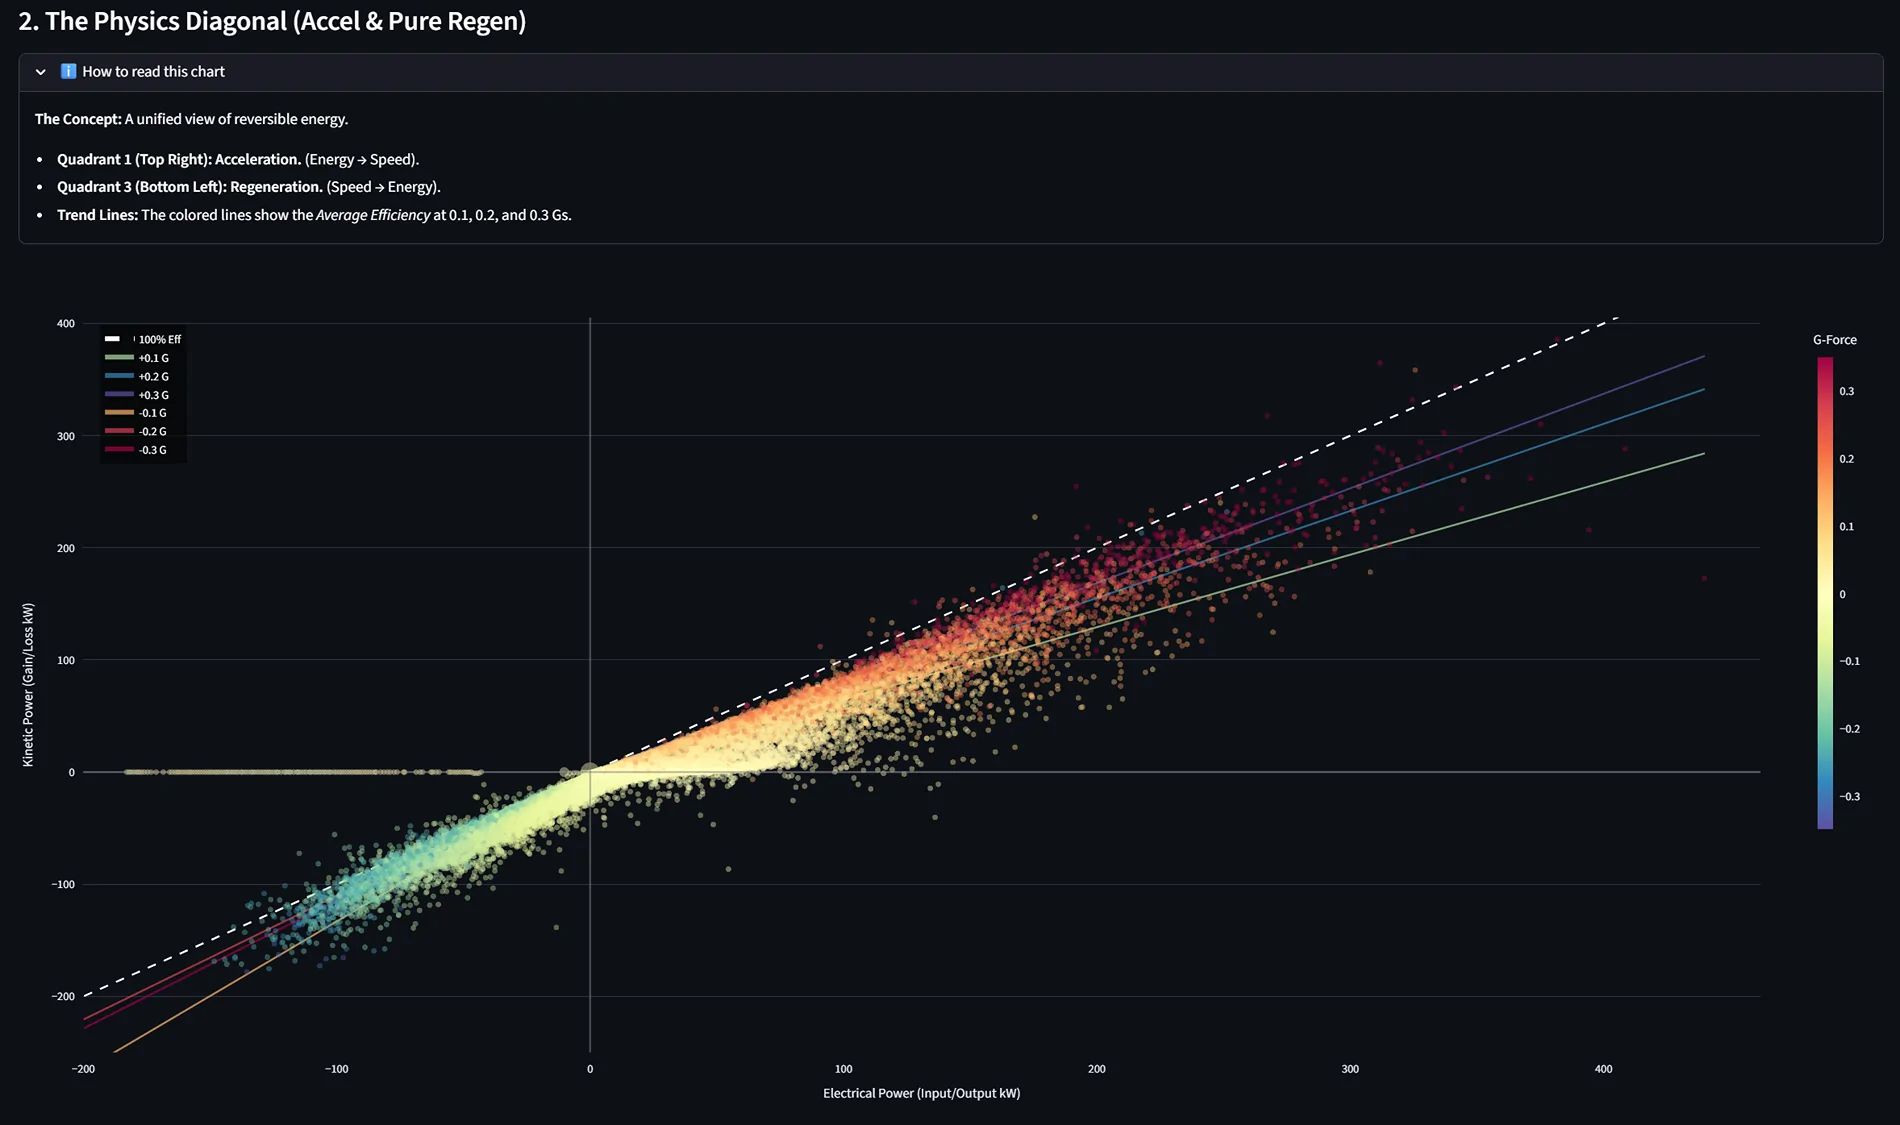
2. Acceleration & Speed
We know acceleration feel tapers off at higher speeds, and the data confirms why:
Wind Resistance: Obviously, the "brick" shape of the truck plays a role.
Current Limiting: The data shows the truck actively tapers current once you cross approximately 60 mph. You can see the clear "roll-off" in the current chart at the top end of the speed range.


3. Battery Capacity & Temperature Effects
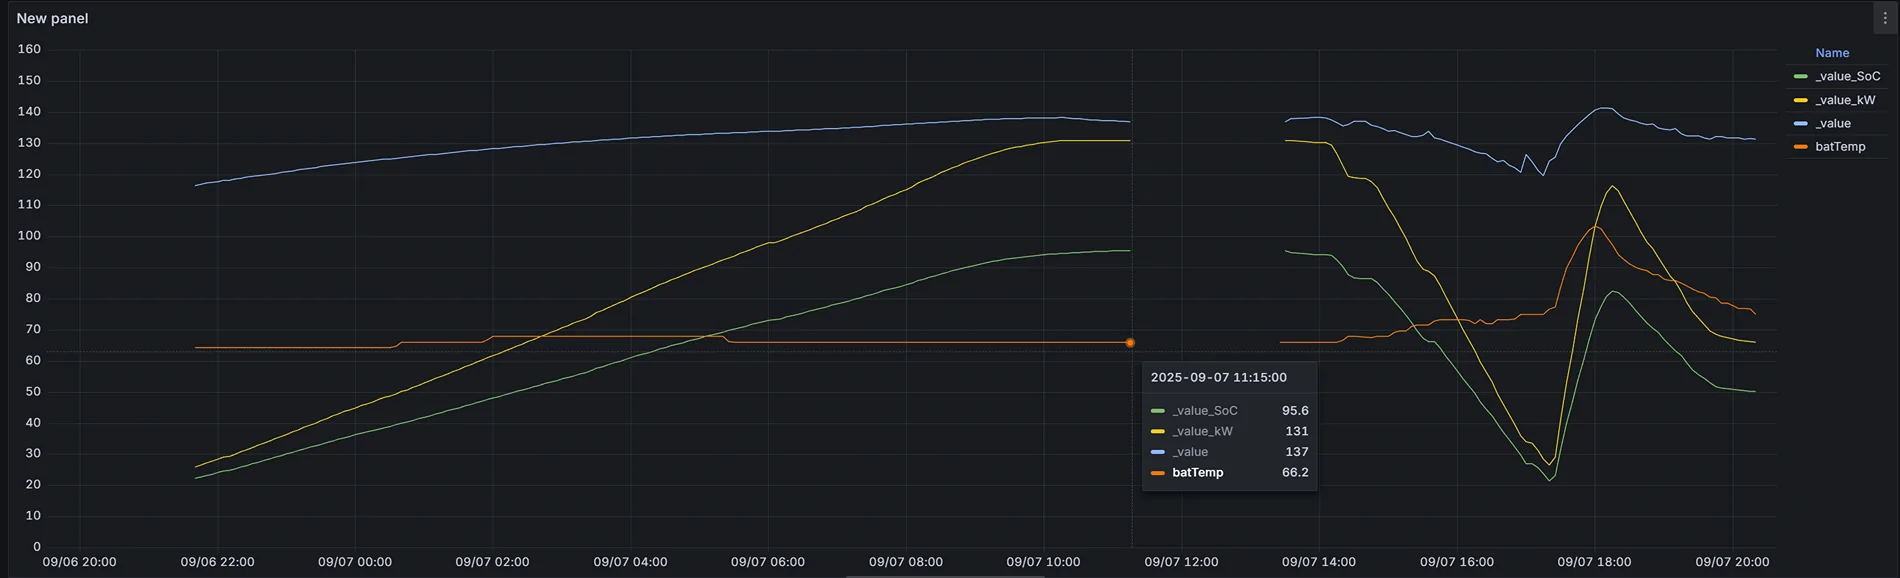
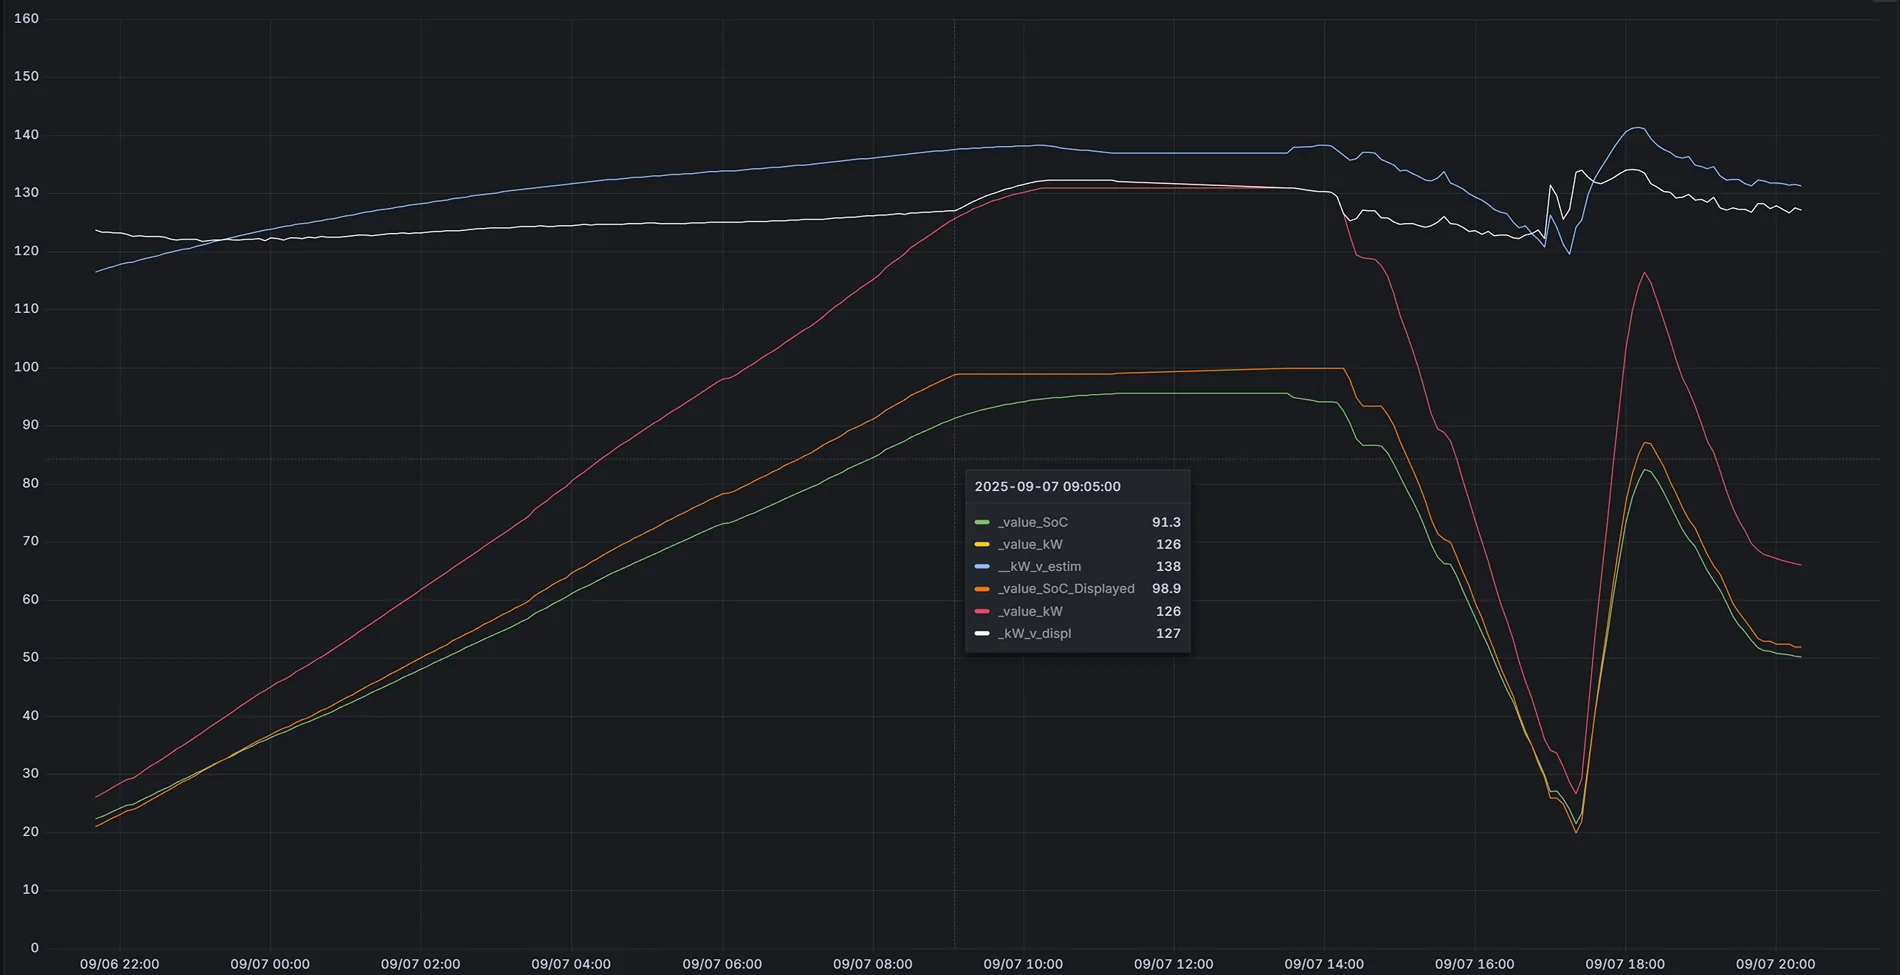
Does temperature affect stored energy? Yes, but the way Ford displays it is the real story.
Energy per 1% SOC: My analysis shows there is more energy per 1% of battery at higher SOCs than at lower ones (the scale isn't perfectly linear).

The "Cold" Manipulation: When looking at energy by SOC colored by temperature, you can see how cold weather affects the pack. More specifically, it shows how Ford's BMS manipulates the displayed SOC to show a "higher" percentage for a given amount of raw energy when temps drop.

4. Aerodynamics & Efficiency
I attempted to correlate average power by speed and temperature. While the speed/temp data is interesting, trying to isolate the effects of wind speed and direction on efficiency has been difficult—the data is still a bit too noisy to draw a "smoking gun" conclusion there.


Sadly attempts to determine the effects of wind speed and direction on efficiency are not as clear.
5. Tire Pressure (TPMS)
I tried to quantify the efficiency gains of higher tire pressure.
The Verdict: My data (and separate controlled tests) suggests that tire pressure has a negligible effect on overall efficiency in this platform.

6. The "Secret" Drive Map
One of the coolest features of the DuckDB setup is the ability to generate a GPS heat map of every drive. I can color the map by any metric—kiloWatts used, motor temp, or speed. (I’m keeping the map private for obvious reasons, but the visualization is a game-changer for spotting efficiency "black holes" on my daily routes!)
I want to be clear—I didn’t manually write the code for this. I used Google Gemini as my lead engineer to build the entire backend. If you’ve been sitting on piles of CSV logs but don't know Python or SQL, this is the way to do it.
What the AI handled:
The Setup:
- Hardware: An old phone permanently mounted in the cubby.
- Software: Torque Pro (logging) + Tasker + Auto-upload to Google Drive.
- Backend: Raw logs cleaned and ingested into DuckDB using Python scripts.
- The "Brain": Full disclosure—I used Google Gemini to write the Python scripts and build the dashboards. It’s been virtually hands-off once the automation was set up.
1. Performance vs. State of Charge (SOC)
A common question is whether the truck limits current as the SOC drops.
Current: Looking at the data, the answer appears to be no. Maximum current remains remarkably consistent even as SOC decreases.
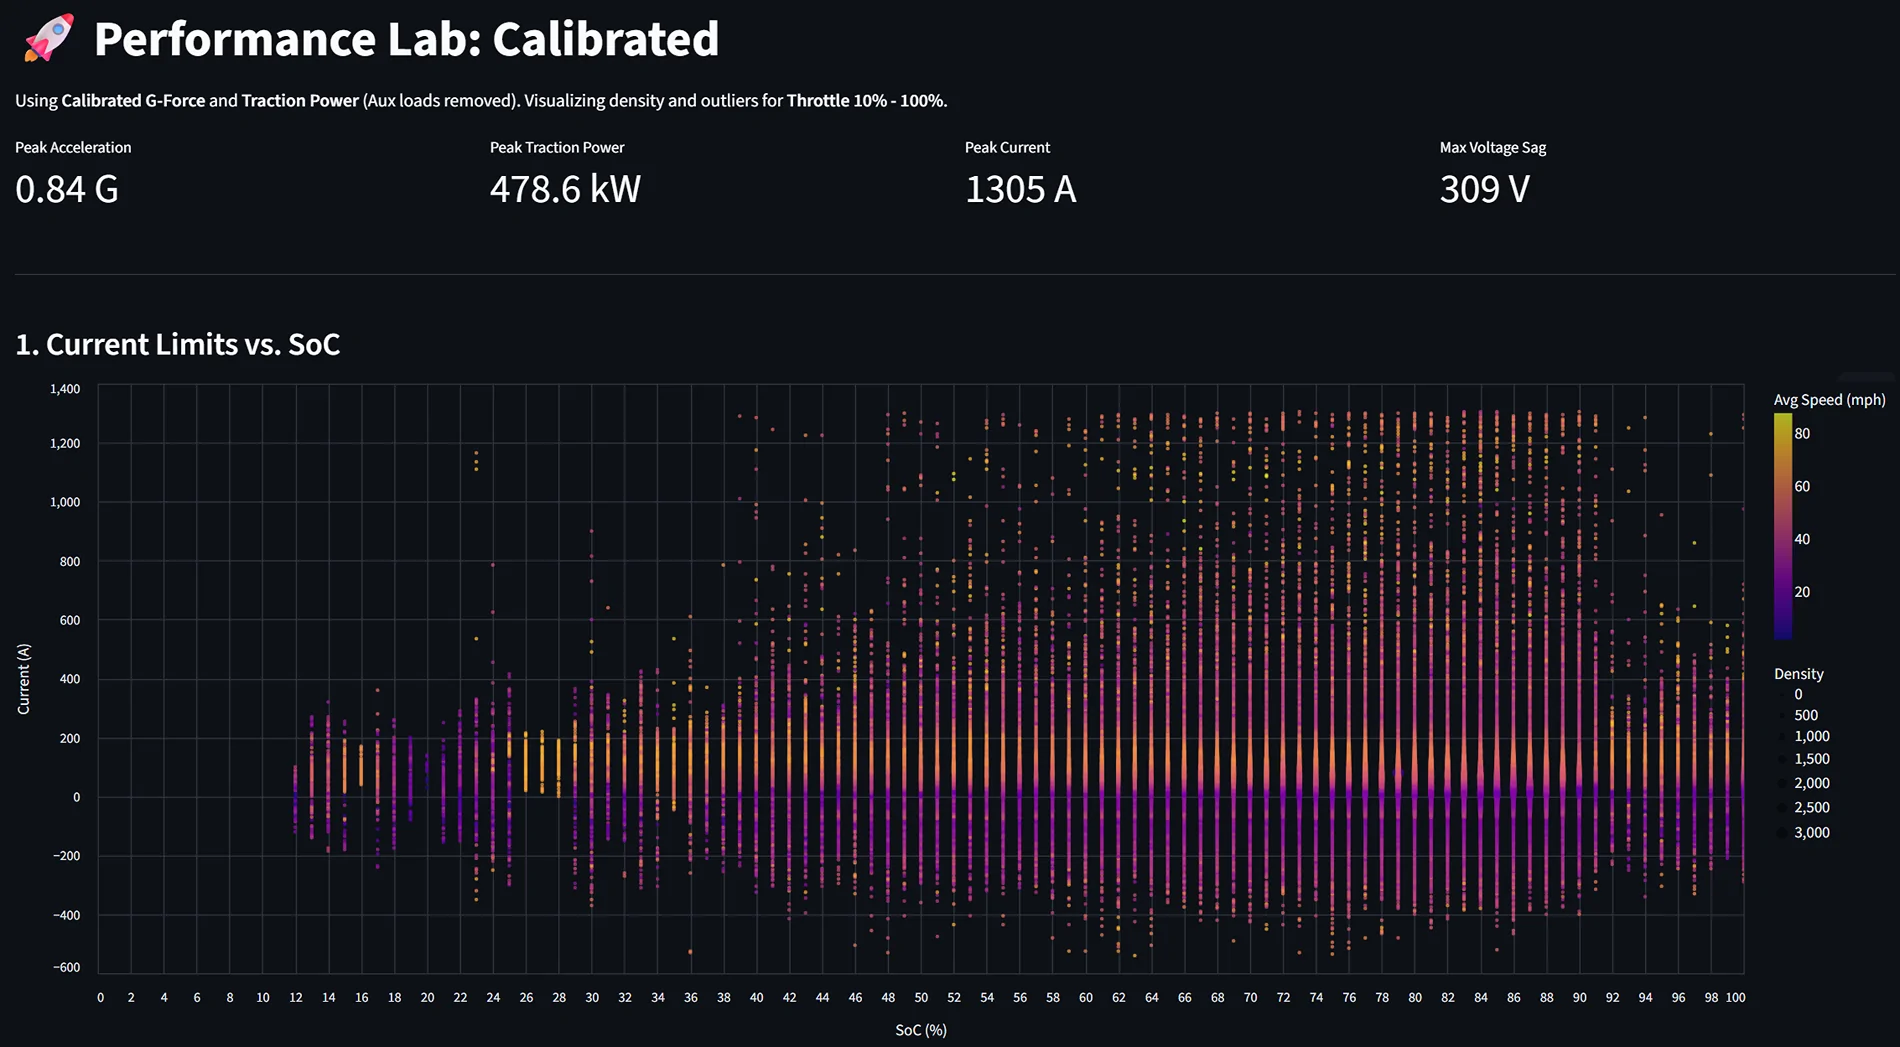
Power: While current stays steady, total power does drop slightly as SOC falls. This is the expected result of voltage sag as the battery depletes.
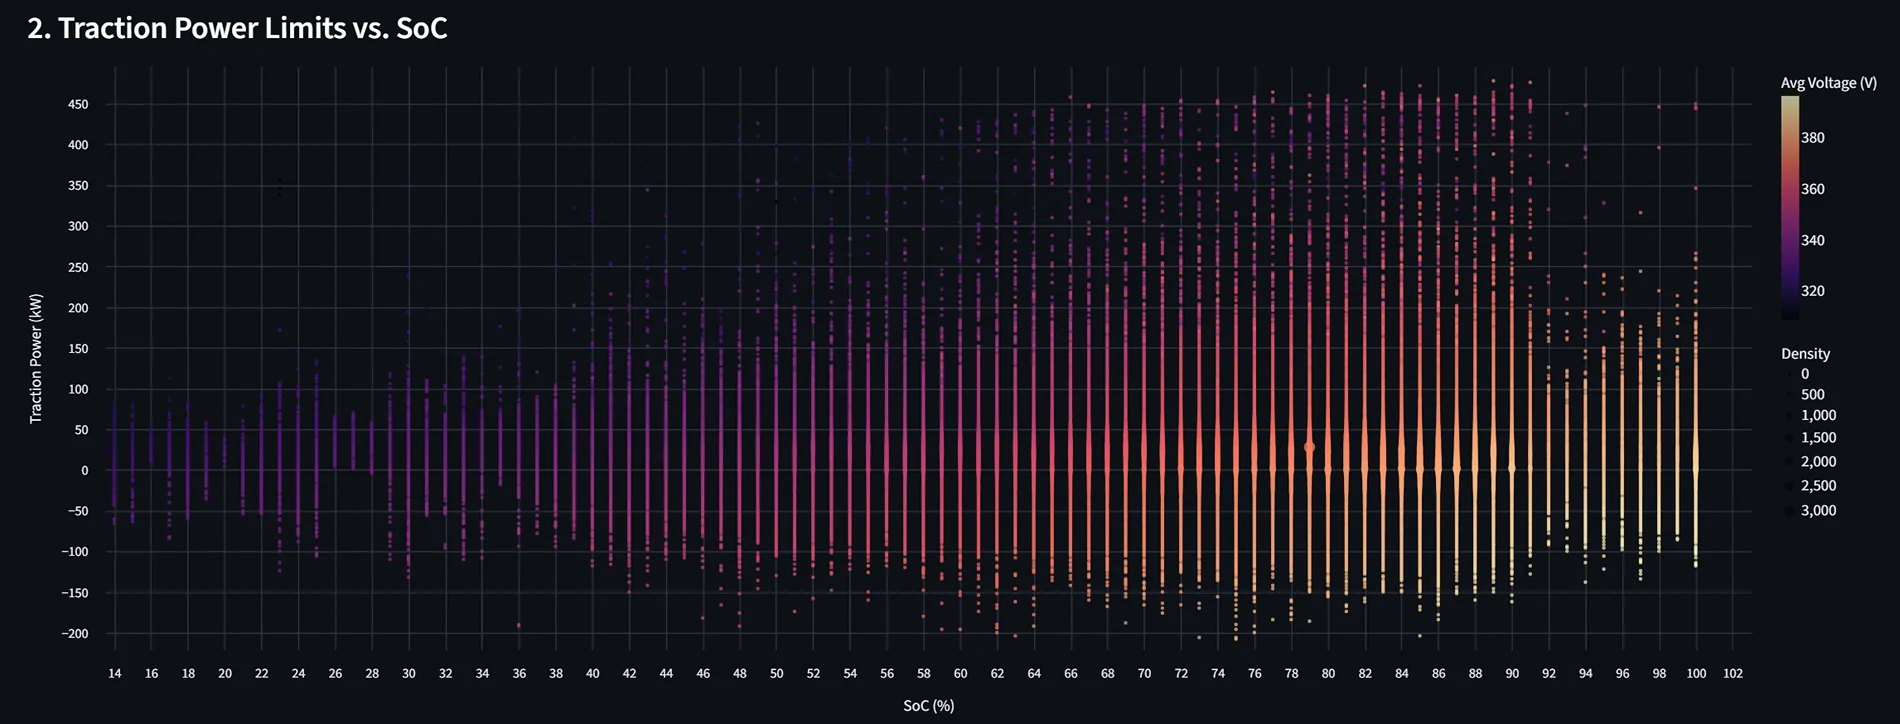
2. Acceleration & Speed
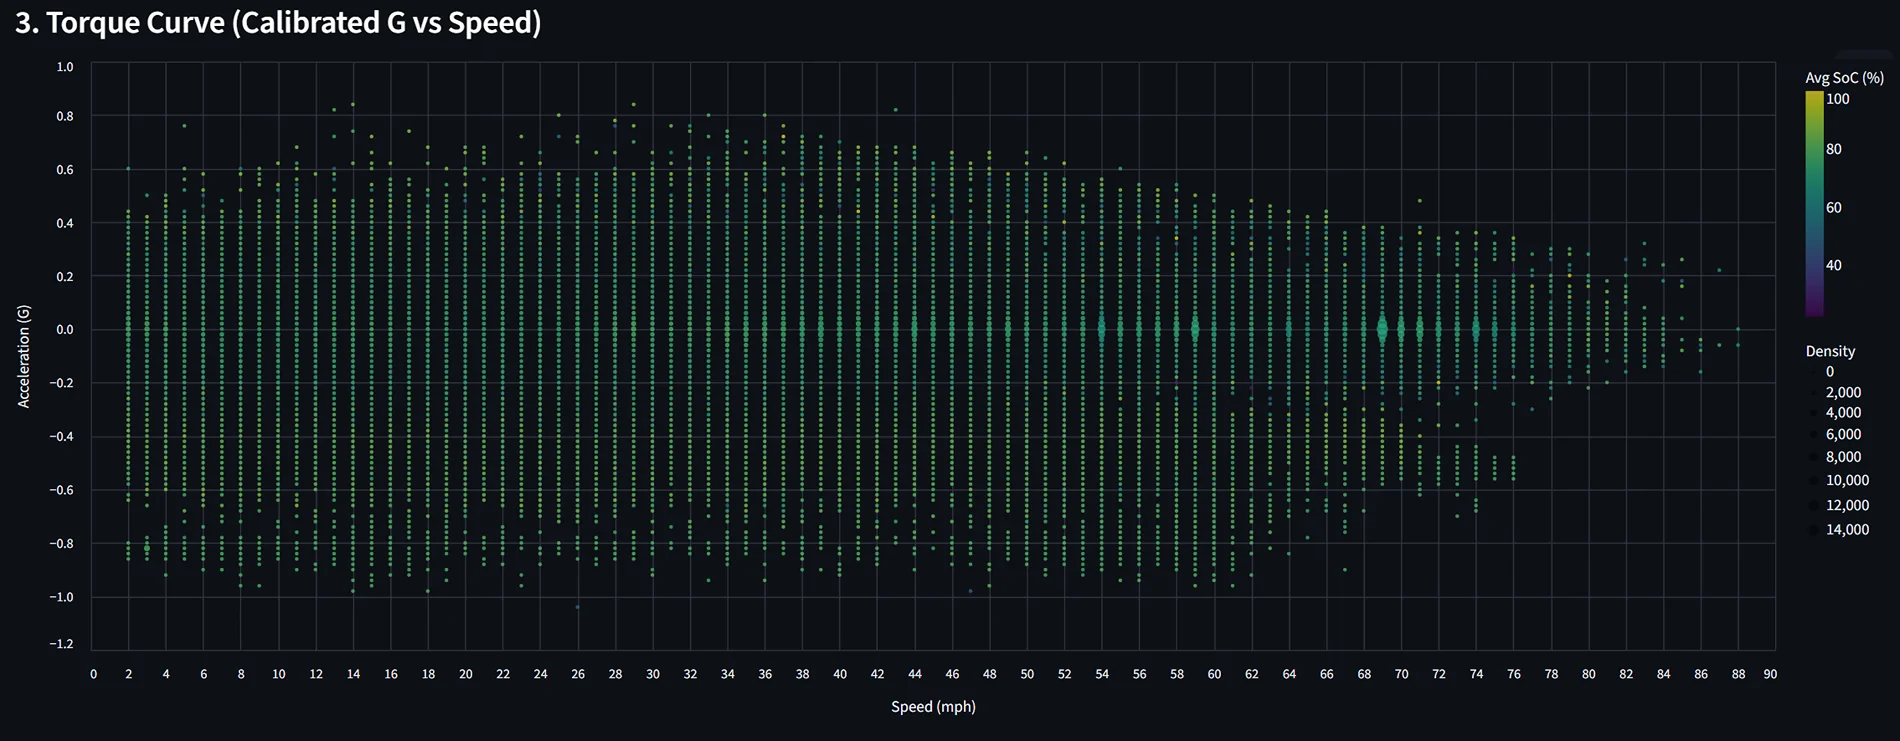
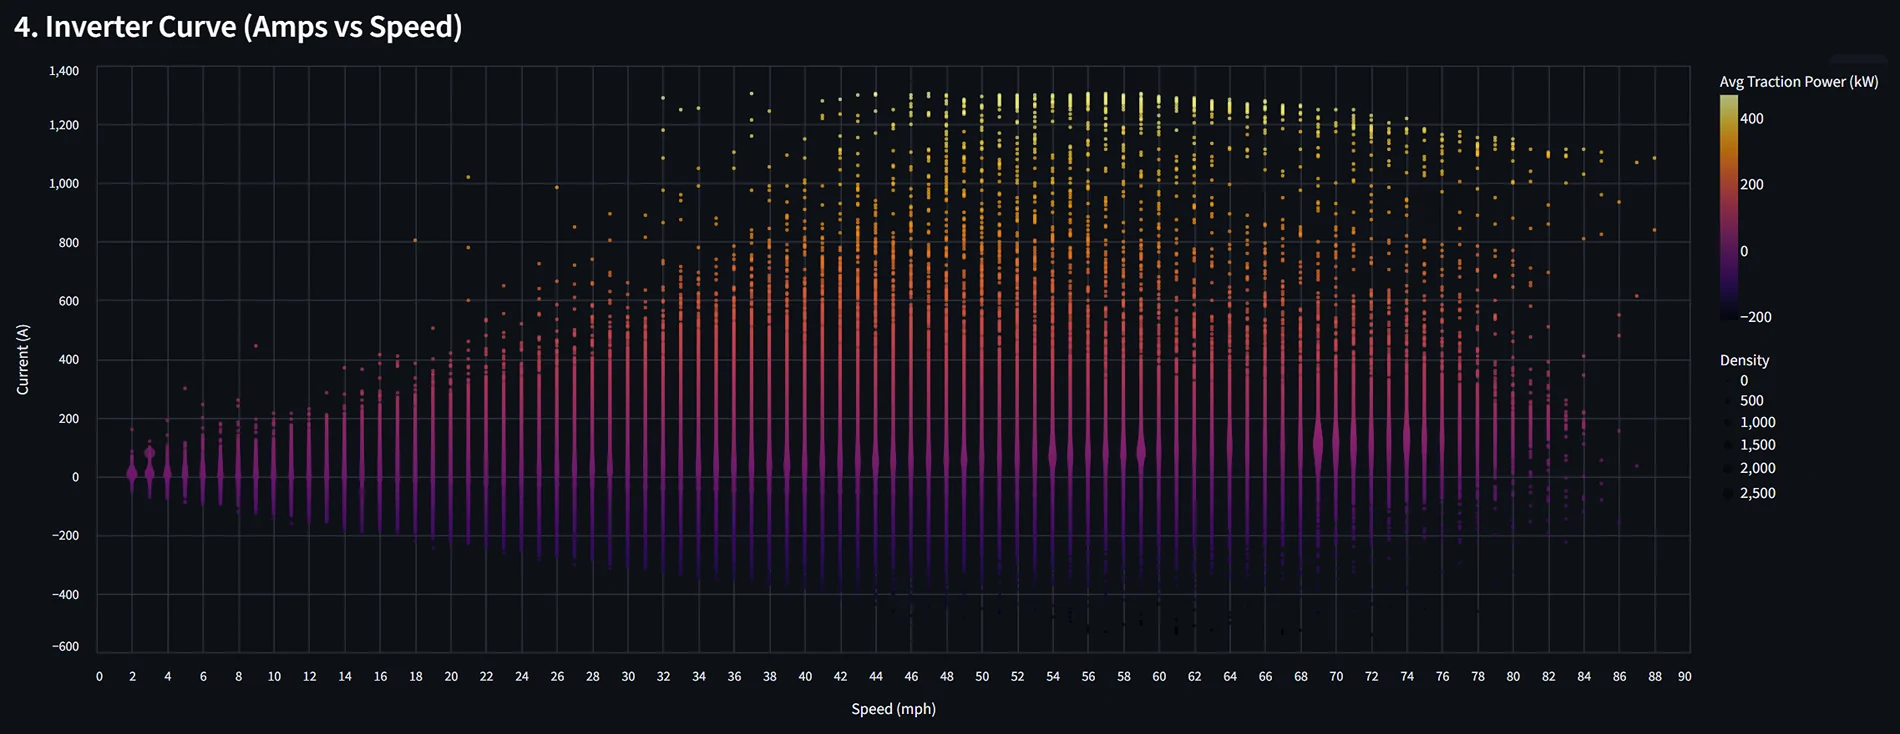
We know acceleration feel tapers off at higher speeds, and the data confirms why:
Wind Resistance: Obviously, the "brick" shape of the truck plays a role.
Current Limiting: The data shows the truck actively tapers current once you cross approximately 60 mph. You can see the clear "roll-off" in the current chart at the top end of the speed range.
3. Battery Capacity & Temperature Effects
Does temperature affect stored energy? Yes, but the way Ford displays it is the real story.
Energy per 1% SOC: My analysis shows there is more energy per 1% of battery at higher SOCs than at lower ones (the scale isn't perfectly linear).
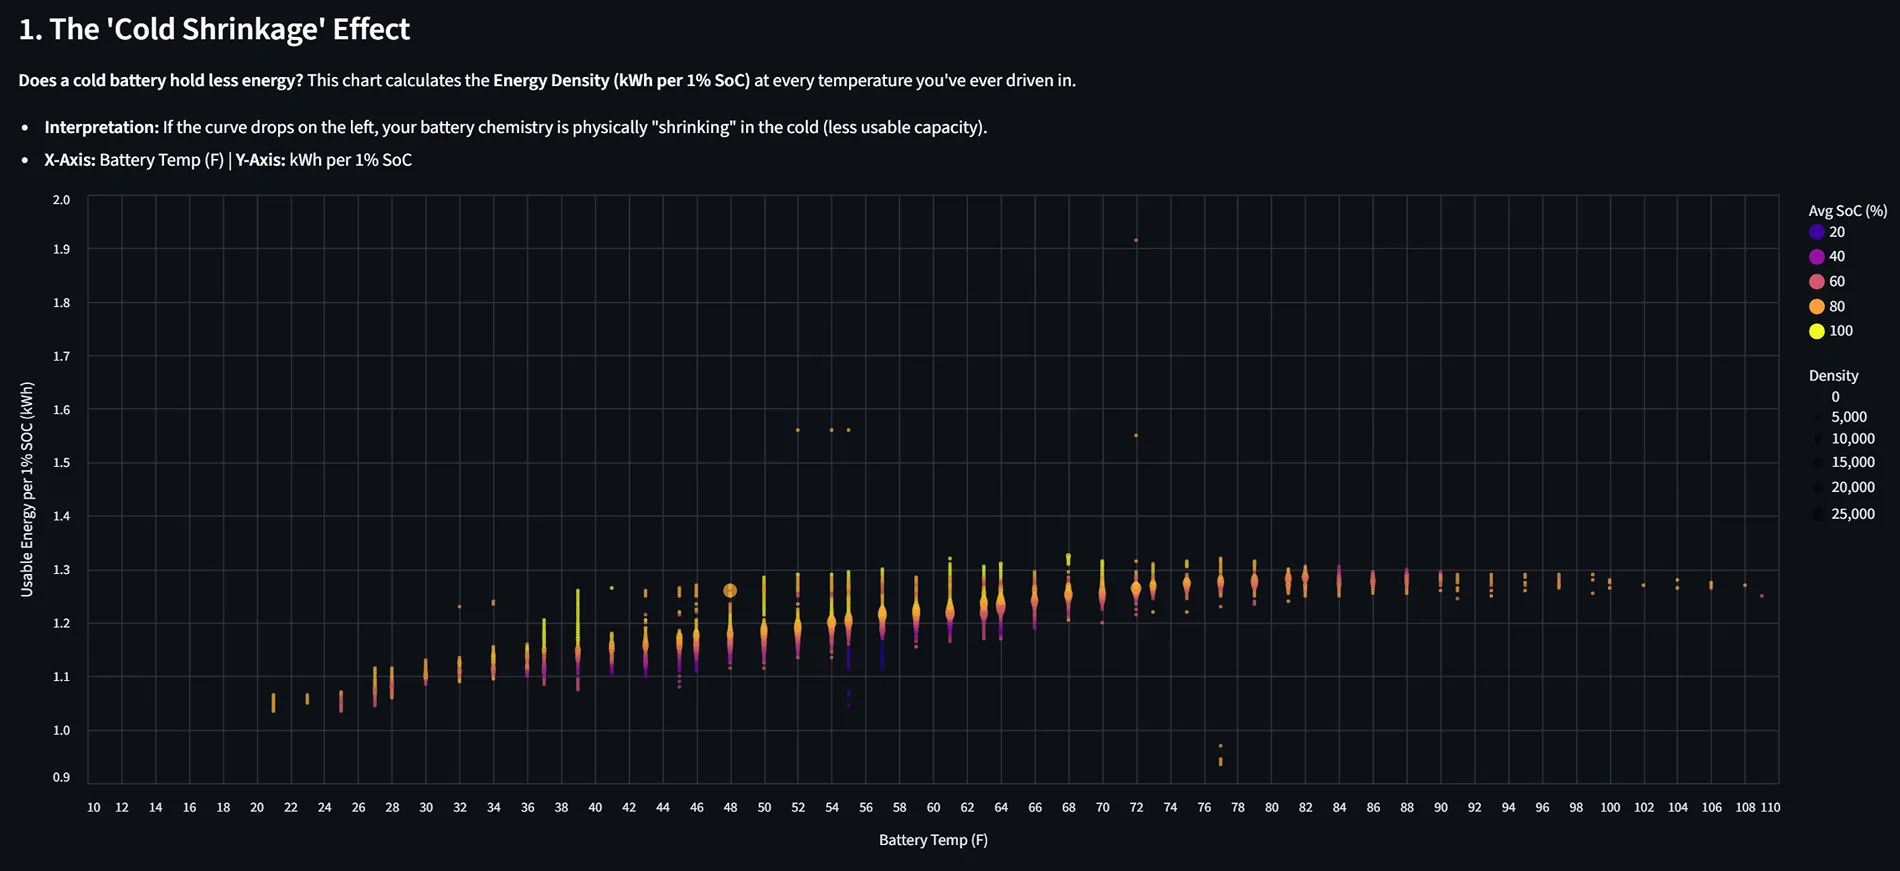
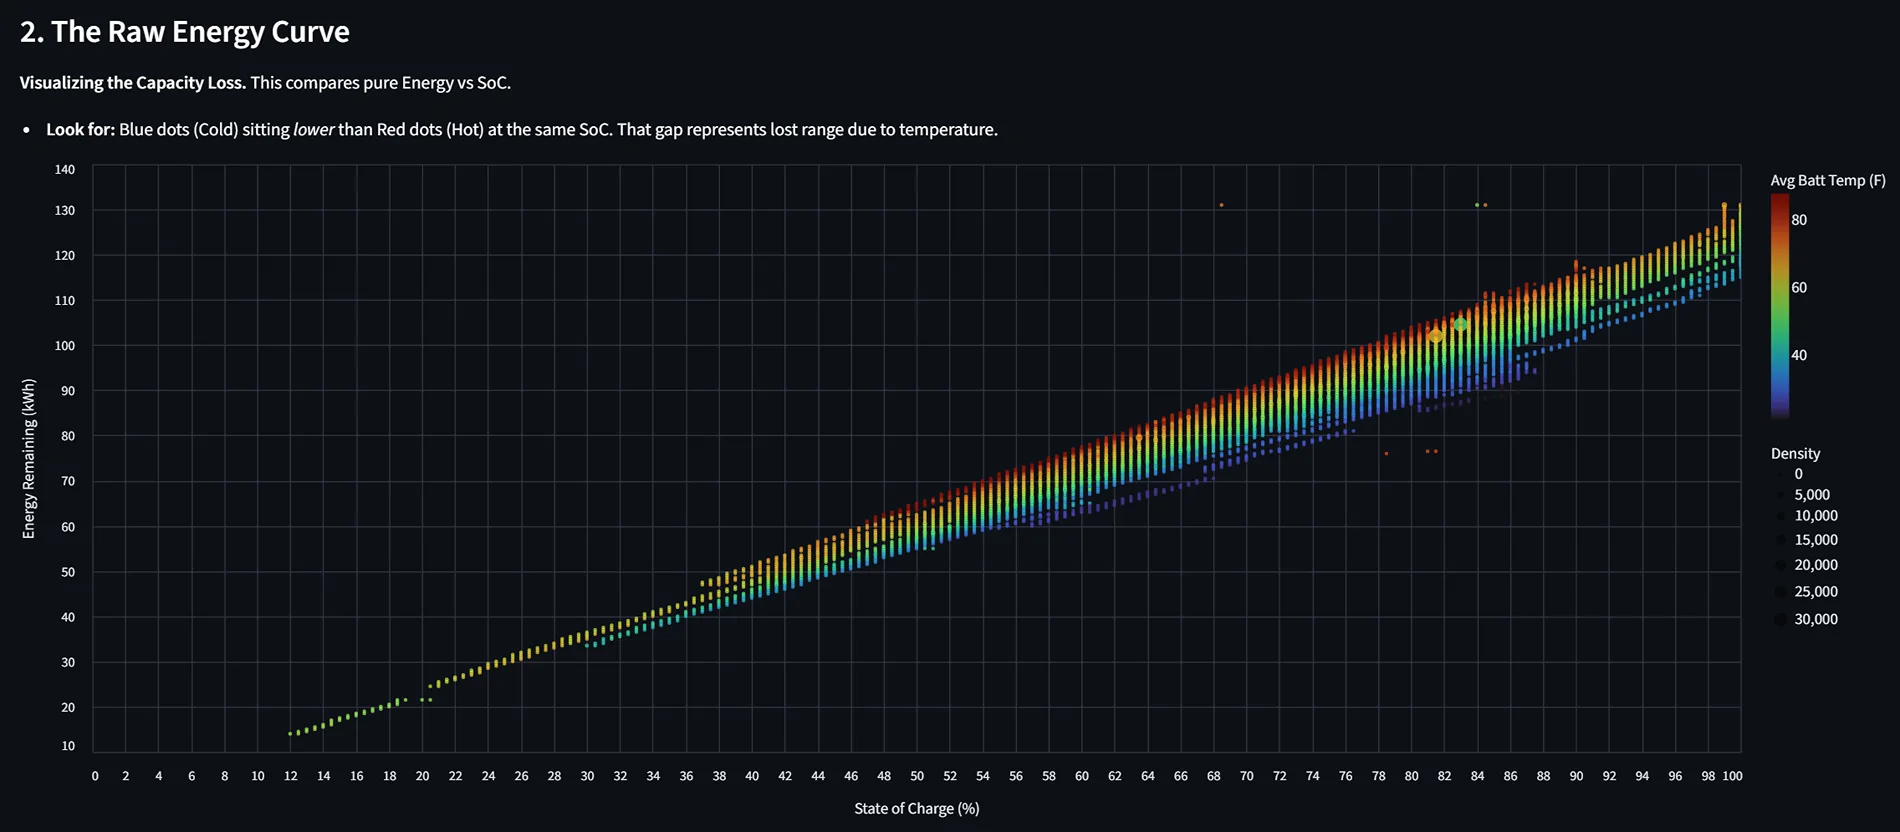
The "Cold" Manipulation: When looking at energy by SOC colored by temperature, you can see how cold weather affects the pack. More specifically, it shows how Ford's BMS manipulates the displayed SOC to show a "higher" percentage for a given amount of raw energy when temps drop.
4. Aerodynamics & Efficiency
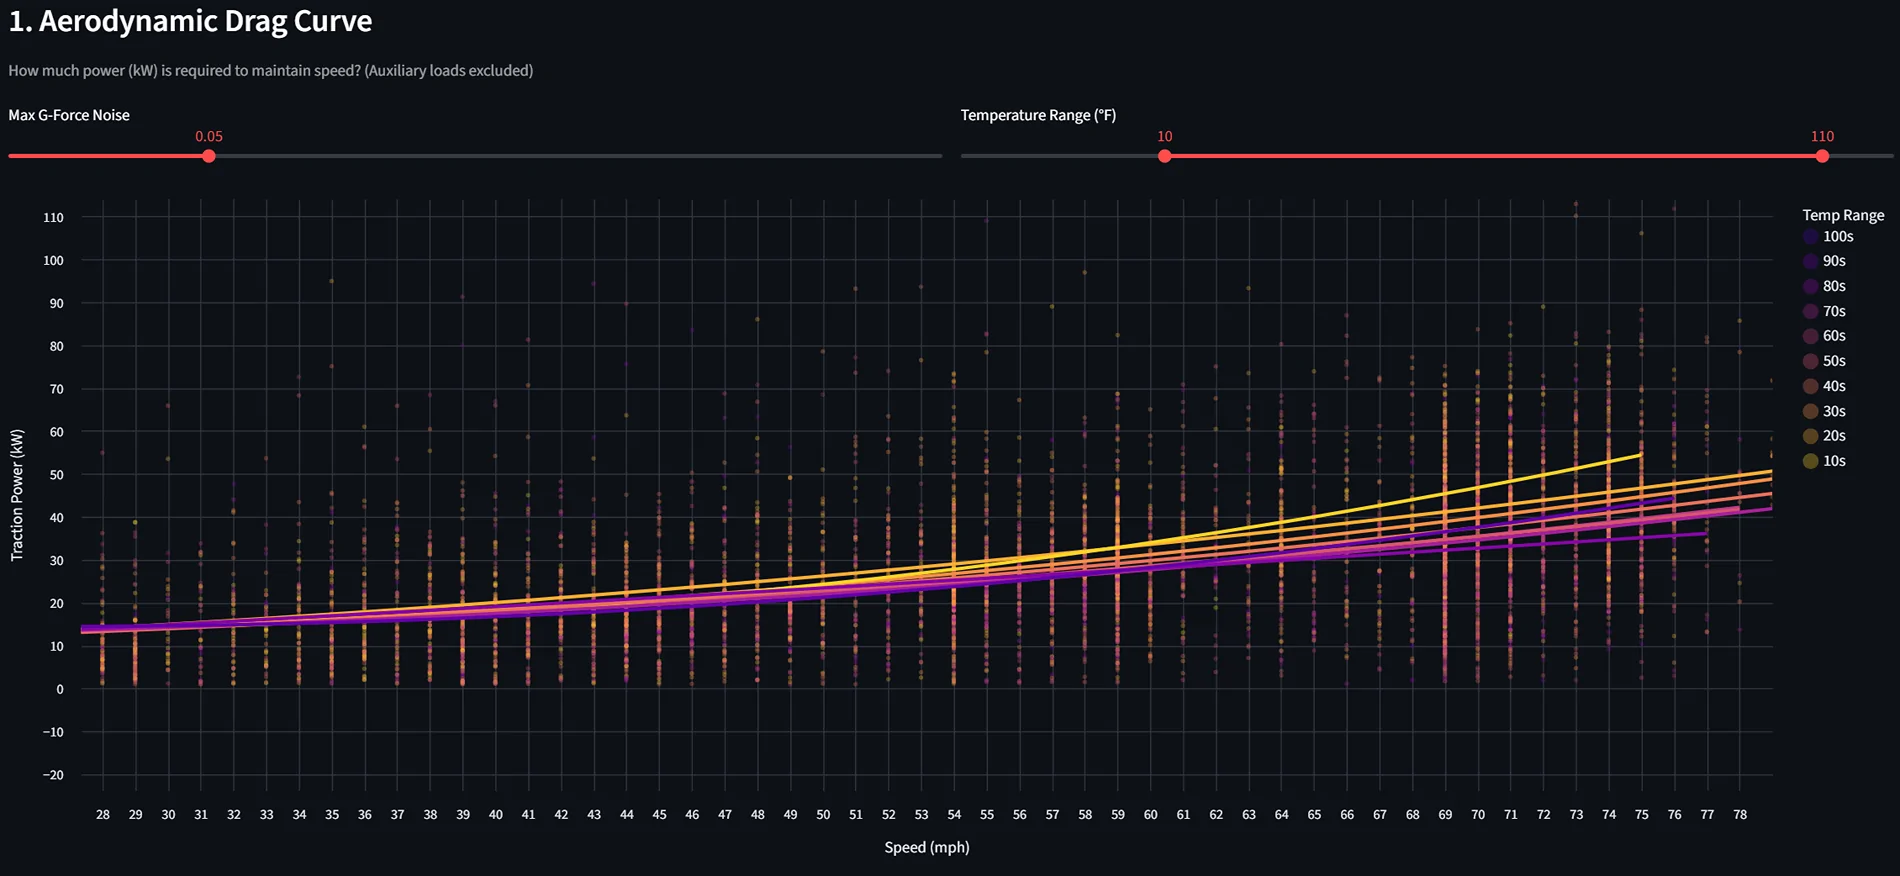
I attempted to correlate average power by speed and temperature. While the speed/temp data is interesting, trying to isolate the effects of wind speed and direction on efficiency has been difficult—the data is still a bit too noisy to draw a "smoking gun" conclusion there.
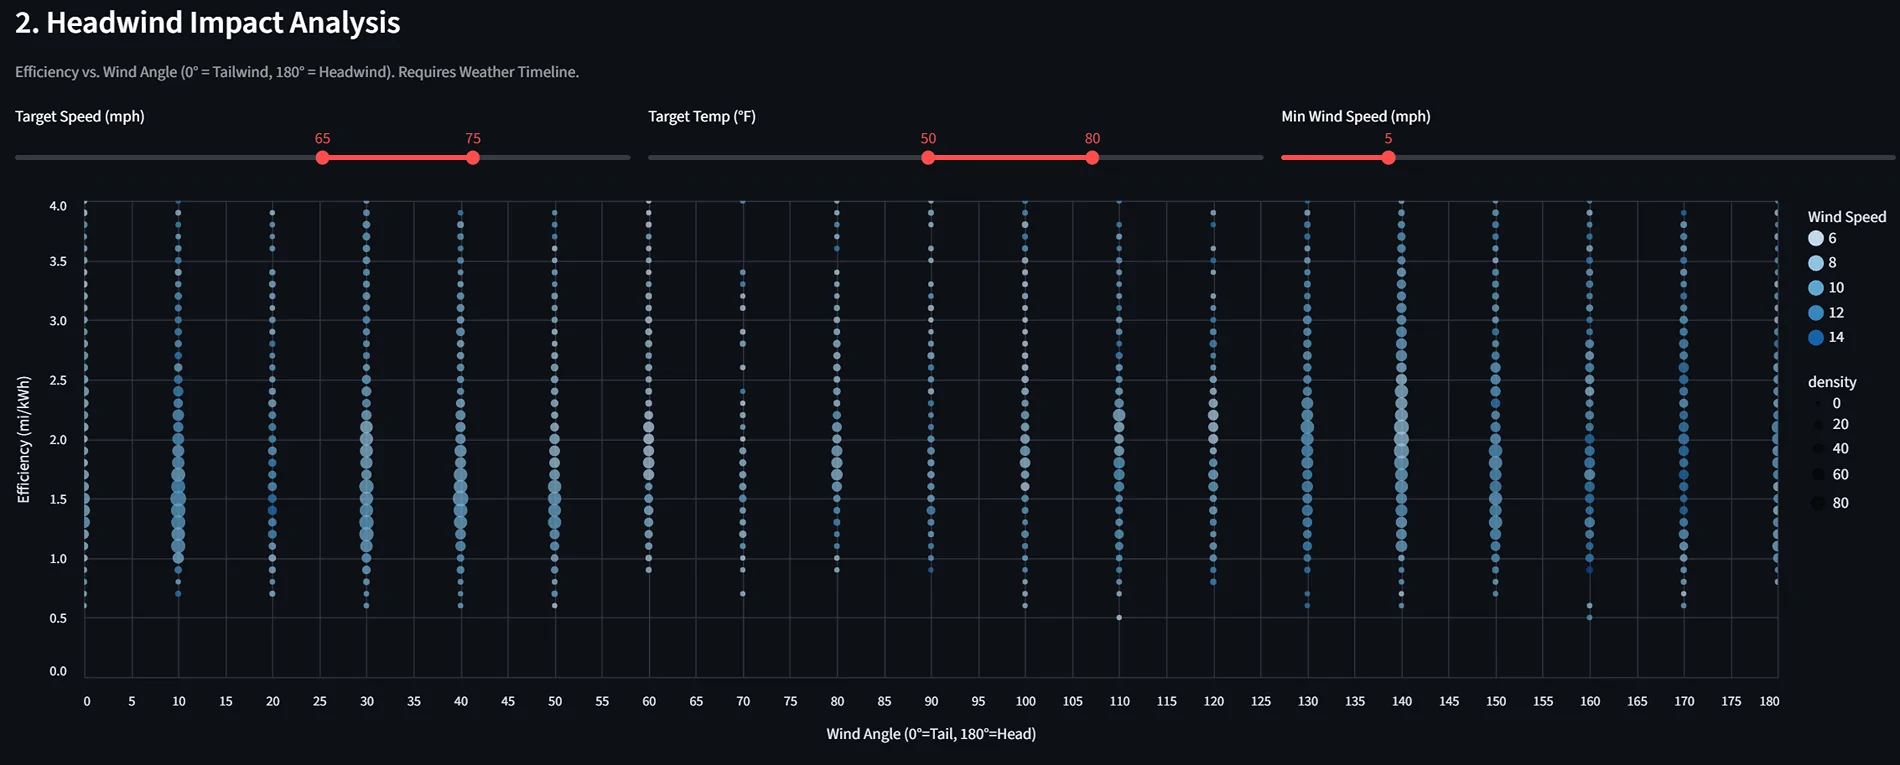
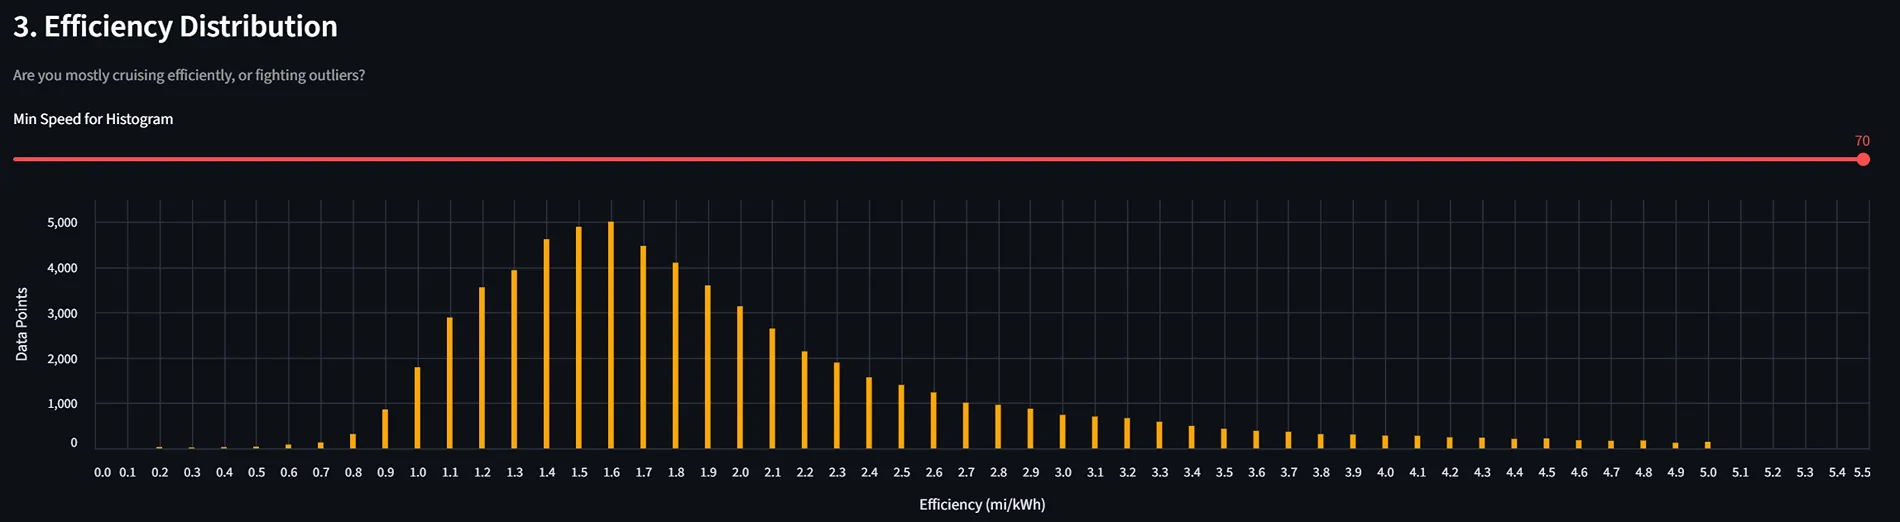
Sadly attempts to determine the effects of wind speed and direction on efficiency are not as clear.
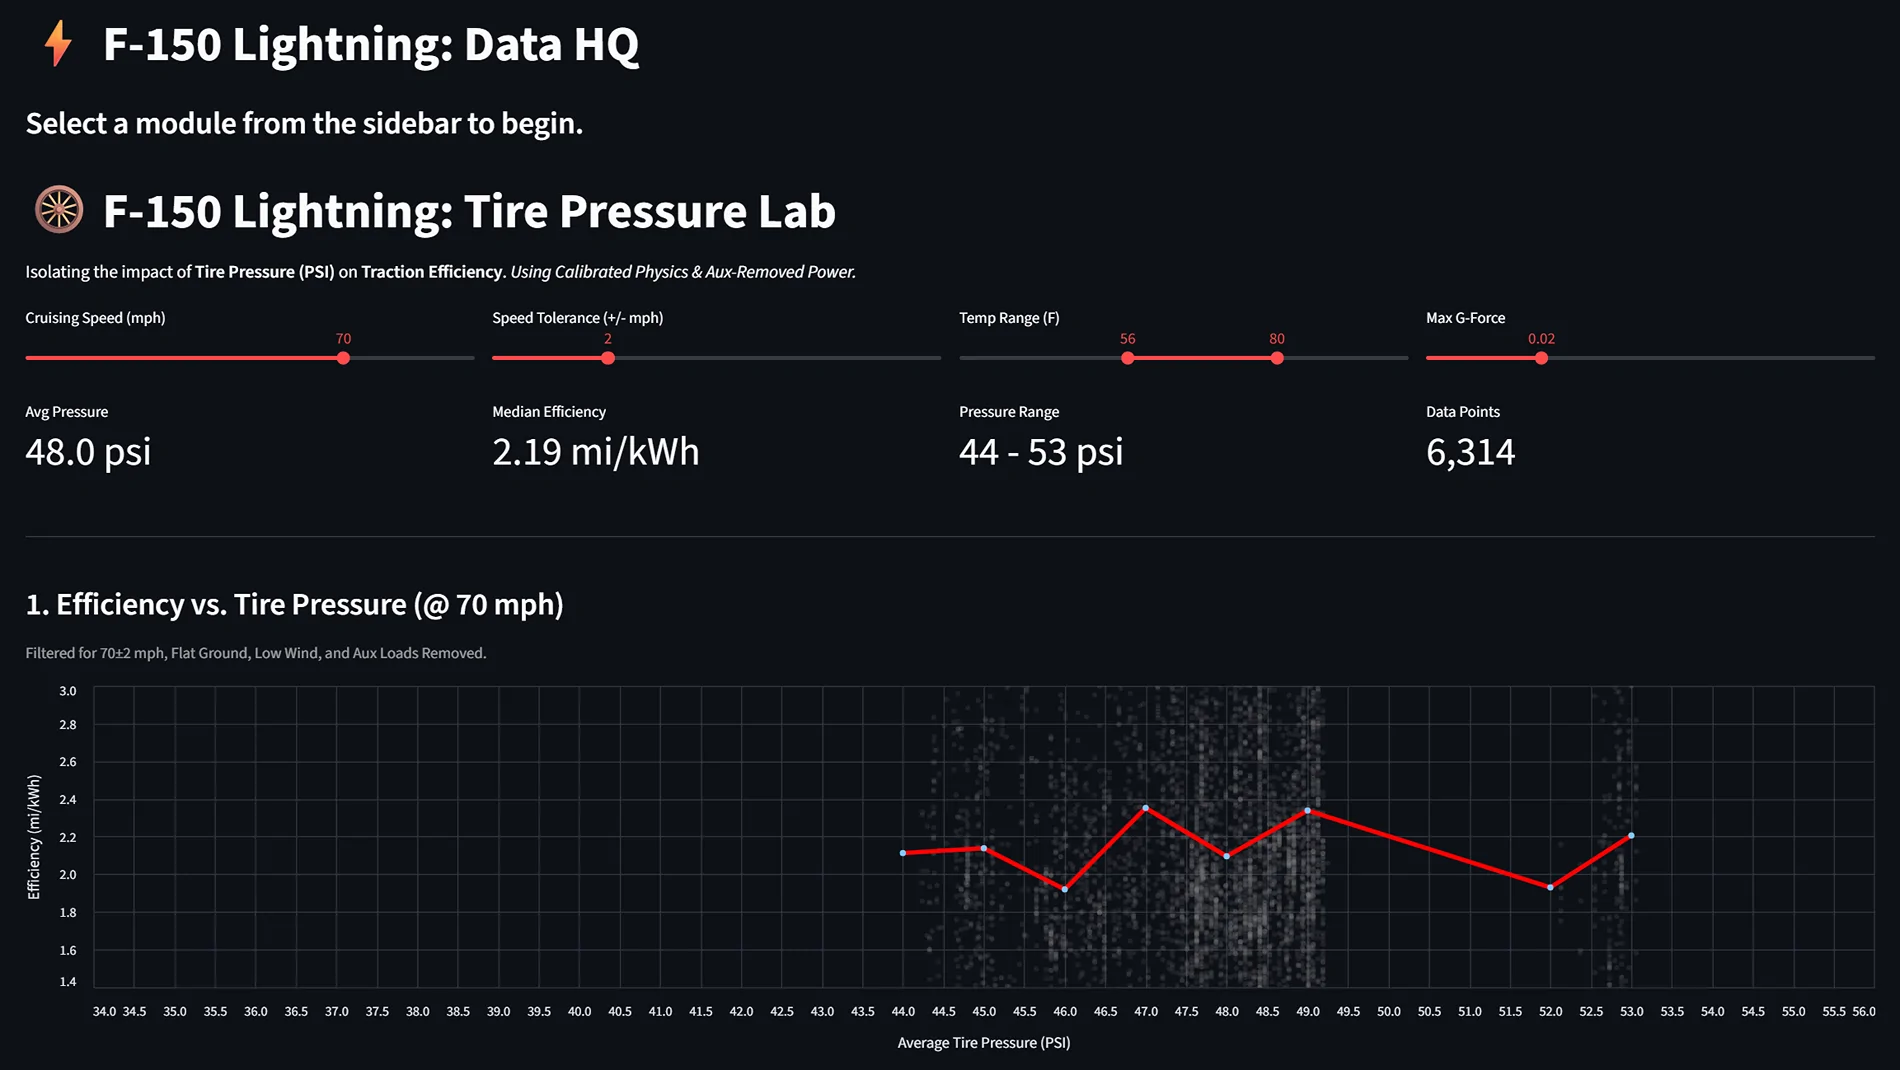
5. Tire Pressure (TPMS)
I tried to quantify the efficiency gains of higher tire pressure.
The Verdict: My data (and separate controlled tests) suggests that tire pressure has a negligible effect on overall efficiency in this platform.
6. The "Secret" Drive Map
One of the coolest features of the DuckDB setup is the ability to generate a GPS heat map of every drive. I can color the map by any metric—kiloWatts used, motor temp, or speed. (I’m keeping the map private for obvious reasons, but the visualization is a game-changer for spotting efficiency "black holes" on my daily routes!)
I want to be clear—I didn’t manually write the code for this. I used Google Gemini as my lead engineer to build the entire backend. If you’ve been sitting on piles of CSV logs but don't know Python or SQL, this is the way to do it.
What the AI handled:
- Python Automation: Gemini wrote the scripts that monitor my Google Drive, grab the raw Torque CSVs, and handle the "cleaning" (fixing timestamps, removing nulls, and filtering out GPS glitches).
- The Database (DuckDB): It devised the logic to ingest that data into DuckDB, creating a high-performance local database that makes querying months of driving data nearly instant.
- The Dashboard Logic: It wrote the Streamlit and Python code to generate the actual charts and performance visuals, including the logic to calculate "Energy per 1% SOC."
- The Workflow: It even helped me set up the .bat files and Tasker triggers so the whole pipeline runs with a single click (or no clicks at all).
Sponsored
Last edited: