mr.Magoo
Well-known member
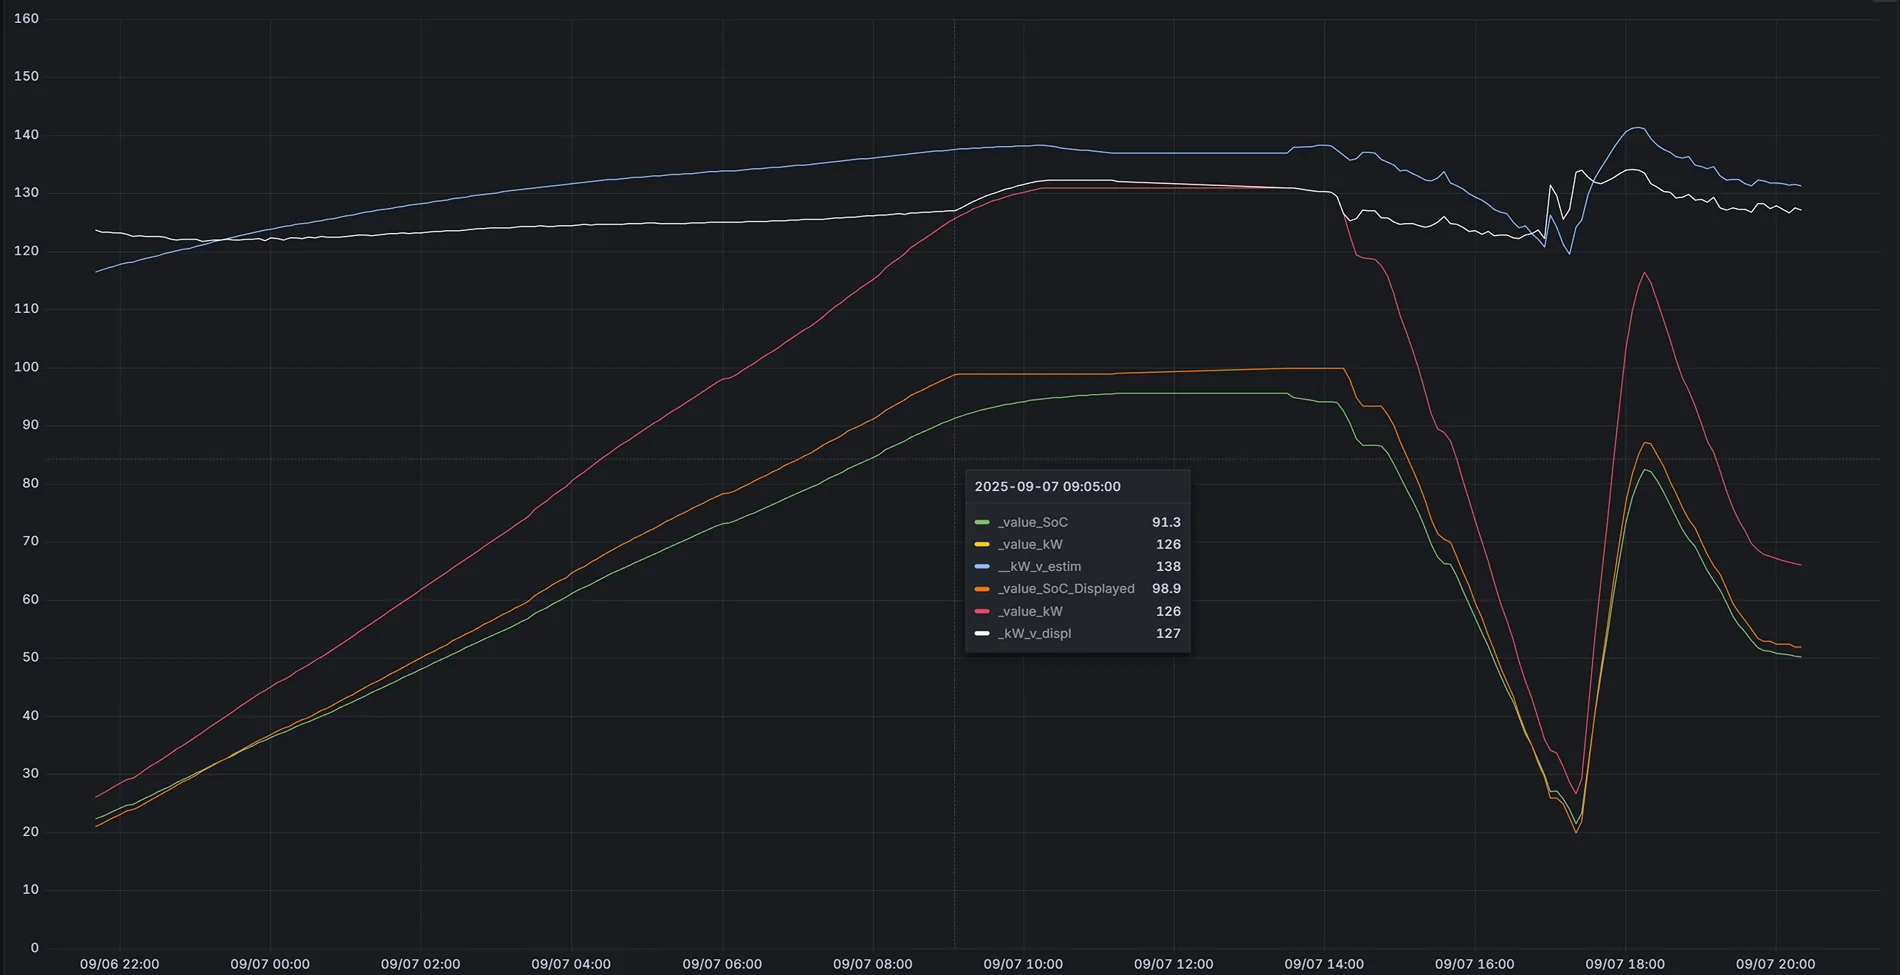
So, you're not telling it to use specific parameters?One of the dangers of using tools like Gemini to do this work is that it isn't as apparent exactly what is going on in the back end. It's possible it's using SOC and not SOC displayed but I don't believe it is.
Sponsored