• Welcome to F150Lightningforum.com everyone!

    If you're joining us from F150gen14.com, then you may already have an account here!

    If you were registered on F150gen14.com as of April 16, 2022 or earlier, then you can simply login here with the same username and password!

Sponsored

Did Ford Change My Usable Battery Capacity to 135 kWh?

Zprime29

Well-known member
First Name
Brandon
Joined
Jul 26, 2022
Threads
32
Messages
1,411
Reaction score
1,394
Location
Tucson, AZ
Vehicles
Honda Pilot, 2022 Lightning ER
I appreciate the efforts at explanation, but what we are looking for is the reason for consistent, new observed change by now 4 of us. Attempts at explaining it as normal or beyond our capability to observe it don’t address the observed change.
Not new. Charged to 100% in June '23 to drive to Phoenix. Made it 15 miles to the freeway and still at 100%. That's flat elevation change (some ups and downs but net gain within a couple feet), 50-55mph, only 3 stop lights, AC cranked for the family.
Sponsored


Henry Ford

Well-known member
First Name
John
Joined
Dec 21, 2022
Threads
4
Messages
627
Reaction score
883
Location
Michigan
Vehicles
2022 F150 Lightning
I just think Ford wants to make the masses happy by presenting an overly optimistic SOC give those in the know it is rarely right? The issue to me continues to be applying our conditional expectations from ICE fuel gages to a highly variable new energy source.
A similar phenomenon occurs with liquid fuel (gasoline, diesel, Jet A). The volume of fuel changes with temperature but typical auto fuel gauges aren't graduated finely enough to tell the difference. This thread wouldn't exist if the Lightning SOC gauge was four tick marks and the word "full."
 
  • Like
Reactions: JRT

MickeyAO

Well-known member
First Name
Mickey
Joined
Apr 2, 2020
Threads
22
Messages
1,009
Reaction score
1,841
Location
San Antonio Tx
Vehicles
Rapid Red Lightning Lariat ER, Kia EV6 GT-Line AWD
Occupation
Lab Manager of the Energy Storage Technology Center
Just to clarify, are you saying that the pack heats up while driving and that explains why we get 7-10 miles before the SOC drops from 100% to 99%? If that is the case, why is it a new finding by a few of us on this board? I will defer to your expertise on the temperature issue. That would be a plausible explanation, if not for the fact that it's a new finding. I watch this stuff all the time, and I've seen it repeatedly where I didn't see it before. Two others have corroborated it. So the question that needs answering is why are we seeing it now when we didn't see it before?

I proposed a couple of possibilities--either the usable capacity was increased by Ford, without changing the denominator. So we start at 135/131 and don't get down to 99% until 130/131. Dashboard won't show 103%, so it stays at 100 until it gets to 99. Or, the truck now thinks 127 is a full charge. There may be others, but saying that nothing has changed doesn't satisfy my curiosity.

Still waiting for the person with an OBDII reader to chime in. Not looking forward to getting bashed again here, though, and I know it's coming. Thanks for your help.
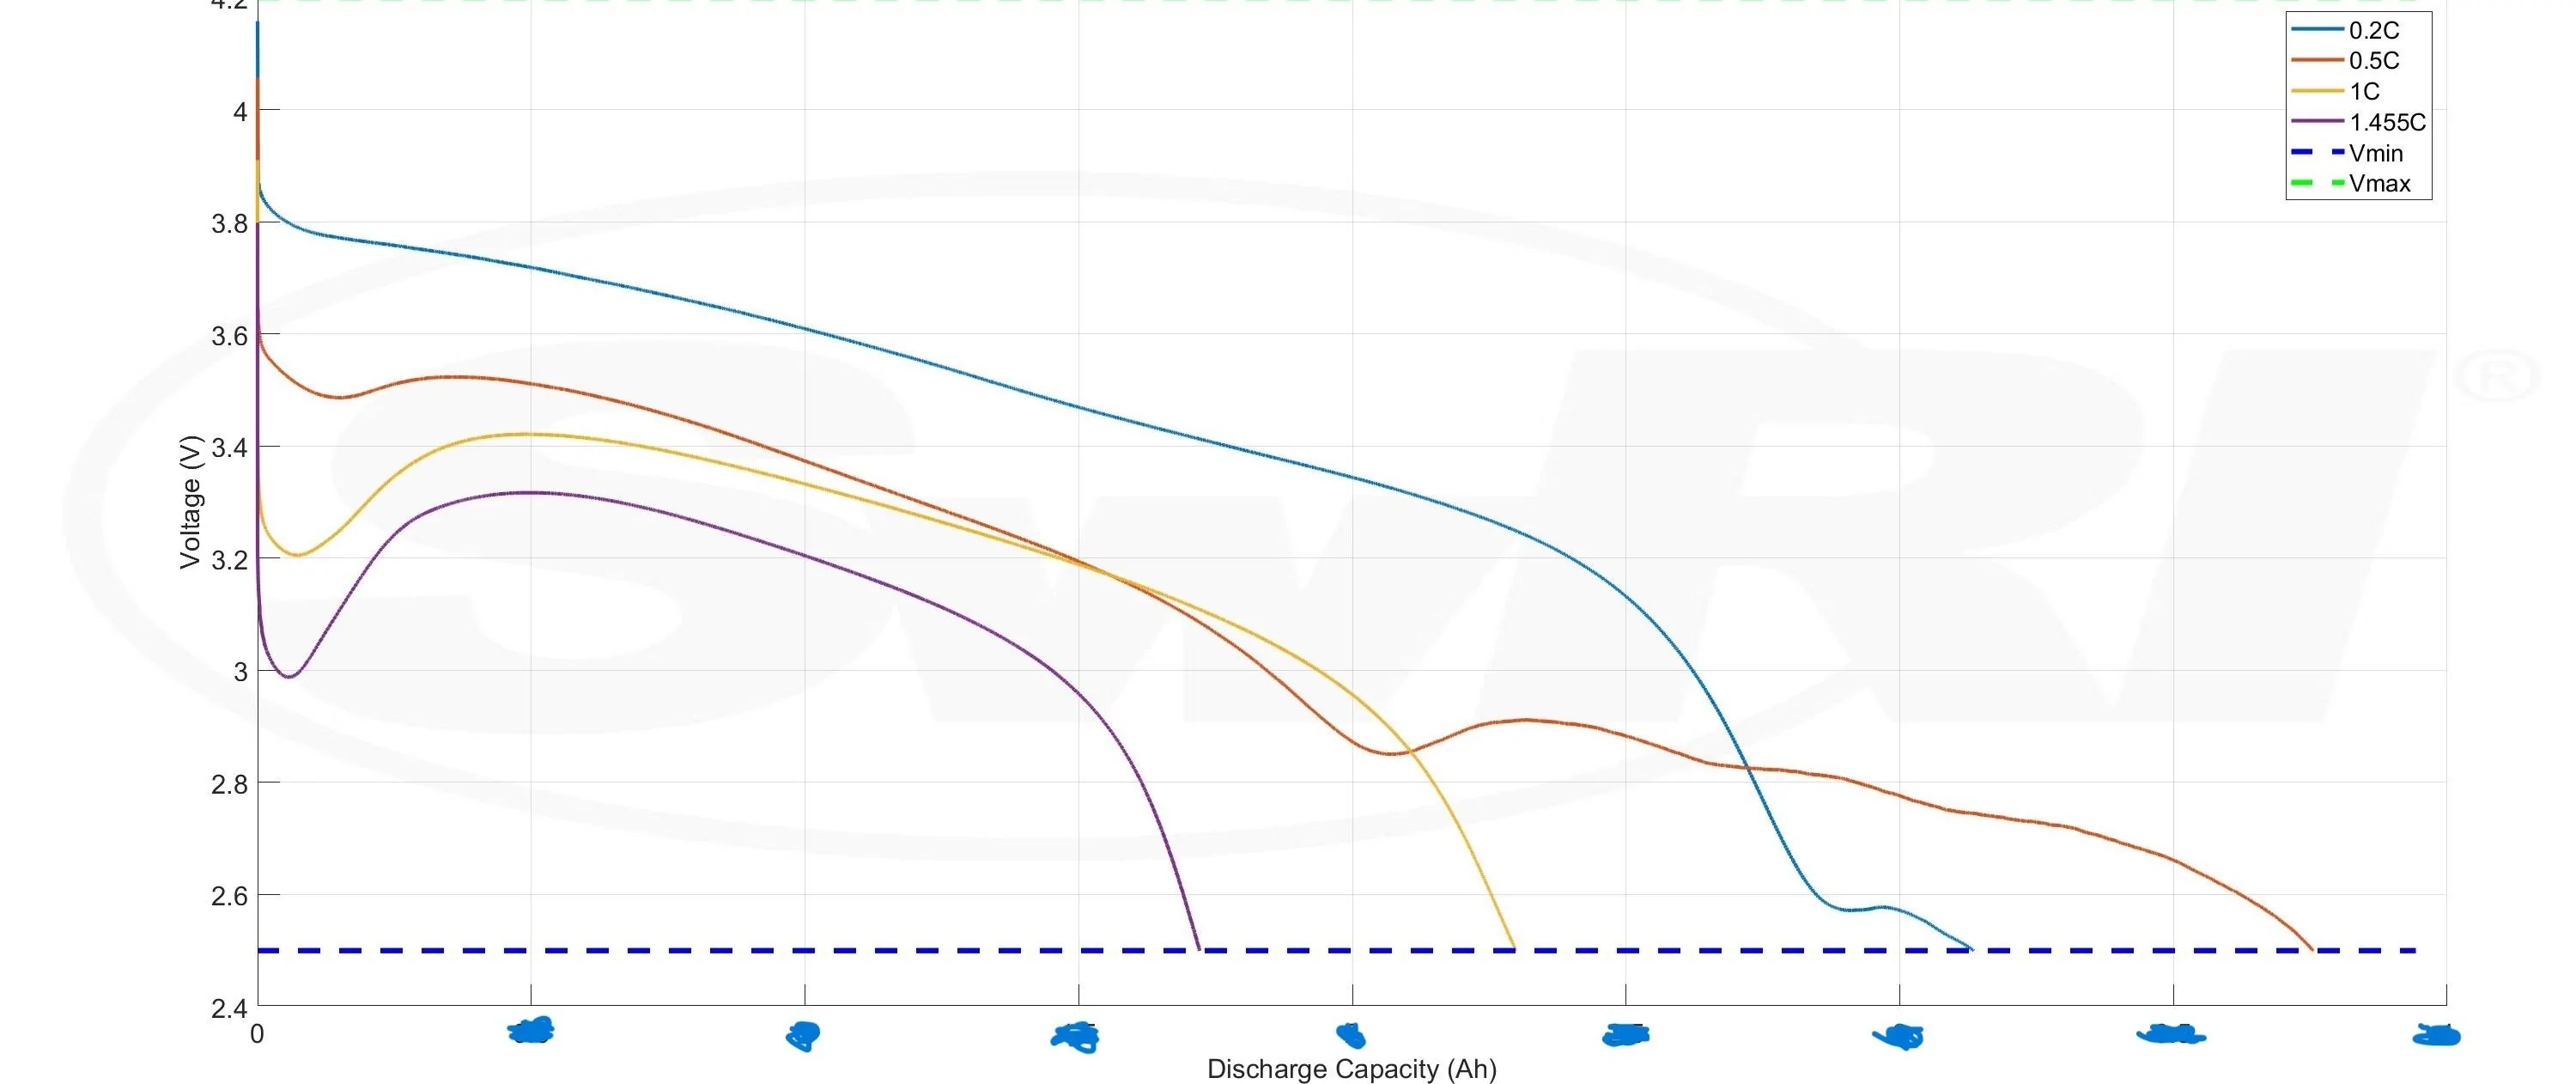
How about a graph (heavily normalized so you can't see what cell it is or the actual capacity)? This is several discharge rates with the voltage on the Y axis and discharge capacity on the X axis. In normal conditions, you would expect the voltage to drop as the cell is discharged.
Ford F-150 Lightning Did Ford Change My Usable Battery Capacity to 135 kWh? Static_Capacity_-_Rate_Composite_(xx°C)plot

Notice how the voltage INCREASES on all of these discharges? As the cells internal temperature increases (because of the discharge) the resistance goes down, and the voltage goes up. If this was in your truck, the SOC would also go up.
 
Last edited:

Jim Lewis

Well-known member
First Name
Jim
Joined
Jan 10, 2023
Threads
31
Messages
564
Reaction score
448
Location
San Antonio, TX
Vehicles
Honda Accord 2017; 2023 Lariat ER
Occupation
Retired
NOTE: For those in the thread Did Ford Change My Usuable Battery Capacity?, by warming my battery from 13 deg C to 19 deg C in 23 minutes, my usable battery capacity at 50% SOC changed from 55.97 kWh to 57.91 kWh.
My average mi/kWh is 2.5. So at 50% SOC, I effectively gained ~5 miles that I could burn up before my SOC dropped to 49%. Closer to 100% SOC, I would gain ~10 miles before my SOC dropped to 99%, if the kWh per SOC % were proportionally increased at 100% SOC.
 
Last edited:
OP
OP

MM in SouthTX

Well-known member
Joined
May 22, 2022
Threads
15
Messages
369
Reaction score
340
Location
Texas
Vehicles
2022 Lightning Lariat
How about a graph (heavily normalized so you can't see what cell it is or the actual capacity)? This is several discharge rates with the voltage on the Y axis and discharge capacity on the X axis. In normal conditions, you would expect the voltage to drop as the cell is discharged.
Static_Capacity_-_Rate_Composite_(xx°C)plot.jpg

Notice how the voltage INCREASES on some of these discharges? As the cells internal temperature increases (because of the discharge) the voltage goes up. If this was in your truck, the SOC would also go up.
You are definitely educating me on battery discharge variability and its effects on voltage, and I do appreciate the responses. Maybe you can see how it answers the “new finding” question, but I don’t see it.

You have to discount my observations (and others’) if you are to explain it as an expected phenomenon, because we weren’t seeing this “buffer above 100%” before and we are now. Science is all about trying to explain our observations. If you just say “I don’t think you are seeing anything new” then there is a breakdown in credibility and we aren’t going anywhere. To your credit, you have not said that out loud, but it is implied.

It’s not important enough to pursue any more. I was just curious.
 

Sponsored

MickeyAO

Well-known member
First Name
Mickey
Joined
Apr 2, 2020
Threads
22
Messages
1,009
Reaction score
1,841
Location
San Antonio Tx
Vehicles
Rapid Red Lightning Lariat ER, Kia EV6 GT-Line AWD
Occupation
Lab Manager of the Energy Storage Technology Center
You have to discount my observations (and others’) if you are to explain it as an expected phenomenon, because we weren’t seeing this “buffer above 100%” before and we are now. Science is all about trying to explain our observations.
The graph was meant to show that as the cell warms up, the voltage will increase. As the voltage increases, the calculated SOC will go up. We are in winter time, so the cells will typically be colder, and will warm up as they are used or preconditioned. And this is also an observation (actual recorded data) that conflicts with you hypothesis if you want to talk about science.

If data presented doesn't lead you to believe that an antidotal observation you seem to hold dear might not be correct, well, you do you Boo. I guess the fact you managed to get Ford to increase your useable capacity, without trumpeting the news to the world, while holding down the rest of us, is a better explanation of the observed and presented data.
 

3121

Well-known member
Joined
Apr 17, 2023
Threads
1
Messages
87
Reaction score
85
Location
SoCal
Vehicles
F150 Lightning Lariat
What you’re seeing is simply the inexactness of determining SoC by measuring voltage, coupled with truncating to whole numbers, and temperature changes.

Just my opinion.
Word to the streets
 
OP
OP

MM in SouthTX

Well-known member
Joined
May 22, 2022
Threads
15
Messages
369
Reaction score
340
Location
Texas
Vehicles
2022 Lightning Lariat
The graph was meant to show that as the cell warms up, the voltage will increase. As the voltage increases, the calculated SOC will go up. We are in winter time, so the cells will typically be colder, and will warm up as they are used or preconditioned. And this is also an observation (actual recorded data) that conflicts with you hypothesis if you want to talk about science.

If data presented doesn't lead you to believe that an antidotal observation you seem to hold dear might not be correct, well, you do you Boo. I guess the fact you managed to get Ford to increase your useable capacity, without trumpeting the news to the world, while holding down the rest of us, is a better explanation of the observed and presented data.
Now we’ve gone ad hominem. Didn’t mean to get to that point. The antidote to this is to end it.
Sponsored


Top